To start, let's generate the data and plot the histogram:
import numpy as np
import matplotlib.pyplot as plt

x = np.concatenate((np.random.normal(loc=-2, scale=.5,size=500),
                    np.random.normal(loc=2, scale=.5, size=500)))

plt.hist(x, normed=True)
plt.xlim([-5, 5])
plt.show()
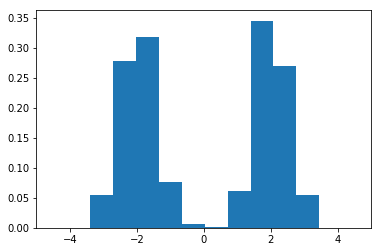
Here we note that there are three regions where the data has low probability to appear. One on the right side of the distribution, another one and the left and another around zero. Let's see if using IsolationForest we are able to identify these three regions:
from sklearn.ensemble import IsolationForest

isolation_forest = IsolationForest(n_estimators=100)
isolation_forest.fit(x.reshape(-1, 1))

xx = np.linspace(-6, 6, 100).reshape(-1,1)
anomaly_score = isolation_forest.decision_function(xx)
outlier = isolation_forest.predict(xx)

plt.plot(xx, anomaly_score, label='anomaly score')
plt.fill_between(xx.T[0], np.min(anomaly_score), np.max(anomaly_score),
                 where=outlier==-1, color='r',
                 alpha=.4, label='outlier region')
plt.legend()
plt.ylabel('anomaly score')
plt.xlabel('x')
plt.xlim([-5, 5])
plt.show()

In the snippet above we have trained our IsolationForest using the data generated, computed the anomaly score for each observation and classified each observation as outlier or non outlier. The chart shows, the anomaly scores and the regions where the outliers are. As expected, the anomaly score reflects the shape of the underlying distribution and the outlier regions correspond to low probability areas.